#Objective
History Request and its Visualization using ChartJs
##Abstract
History Request is sent to a Device with a FieldName so as to read its values over a period of time. Visualizing these Values can be usefull in many ways, like predicting Temperature Change based on the Previous Values of Temperature.
This Week we will use History to get Values of a Field over a period of time from a Device and Display them in the form of a Line Graph.
##Work
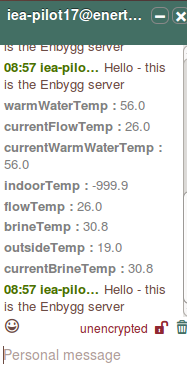
- Send a hardcoded History Query to a Device and get Values of Field over a particular period of Time.
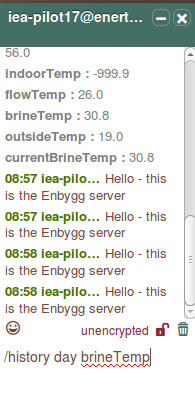
- Extend sending History Query from hardcoded to a command ‘/history day/week/month/year FieldName’ that can be sent to a device using ChatBox.
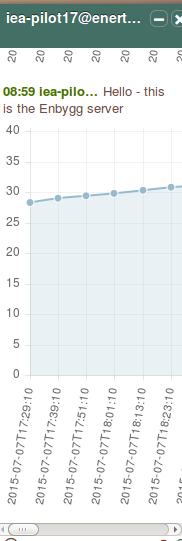
- Parse the Message to Data of ChartJs Line Graph.
- Display Graph as a message in the ChatBox.
##Problems Faced and Work Arounds
####History Command not receiving any messages.
- As this was a part of last week work, It was resolved by sending ‘SEQNR’ as a part of the History Query which is Unique Reference Number for the IQ to identify messages related to that IQ.
##Final Output
##GSOC MID-EVALUATION WEEK
So this is the time when the First GSOC Evaluation takes place. We have completed 90% of what was mentioned as part of Project Timeline. Also the Features Added to Converse can be tested by cloning dev_iot branch from here “https://github.com/adhish20/converse.js/tree/dev_iot” and setting up an Development Environment for it.
##Road Ahead
- Making a Mobile Application of an IoT Client using Apache Cordova.